[GUIDE] How to Install & Enable On-Screen Display in MSI Afterburner (RTSS)
This discussion has a more recent version.

PowerSpec_MichaelB
✭✭✭✭✭


Have you ever wondered how your computer is performing while gaming? Do you feel like your system might be running hot, or that your performance is lacking and you're trying to figure out why? This guide will introduce you to a very helpful set of troubleshooting tools known as MSI Afterburner and Rivatuner Statistics Server (RTSS).
MSI Afterburner's primary feature is GPU overclocking, however for the purpose of this guide, we will be utilizing a very handy secondary feature to enable OSD or On-Screen Display to allow you to monitor a large variety of sensors and statistical information about your systems performance. From CPU/GPU thermals & utilization all the way to in-game FPS, this software is a staple for troubleshooting gaming performance in real-time. Before we begin, a quick disclaimer.
This third party software is to be used at your own risk. Before using it in video games, check with the developers to make sure it is allowed, as the software hooks into the Direct3D frame buffer to capture its performance information and may be viewed as a "cheat" by some anti-cheat software.
With that out of the way, let's get started!
Step 1: Download the latest version of MSI Afterburner from the manufacturers website: https://www.msi.com/page/afterburner
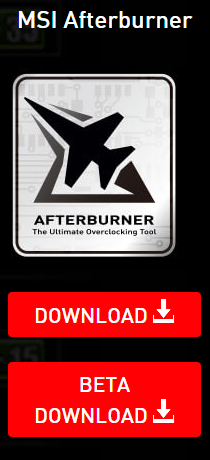
Step 2: Extract the downloaded software to an easily accessible location and run the installer.

Step 3: During installation , make sure you keep RivaTuner Statistics Server checked, as we will need that software to utilize the OSD functionality.
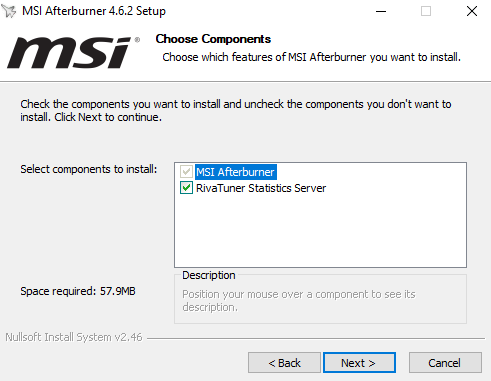
Step 4: Complete the installation process for both MSI Afterburner and RTSS. Remember to switch over to the RTSS installation window as it may not do so automatically. NOTE: The installer may install additional DirectX libraries if they are not currently available on your system, this is normal.
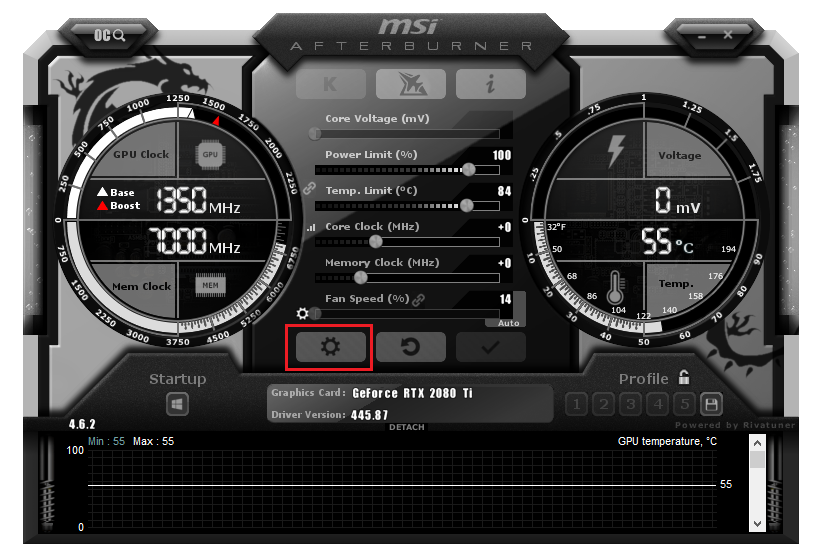
Step 5: Launch MSI Afterburner. Note: You may be greeted with a popup from RTSS informing you that some information cannot be hooked right now. This is completely normal, it simply means some applications are already open and that they cannot be monitored until they are closed and reopened.

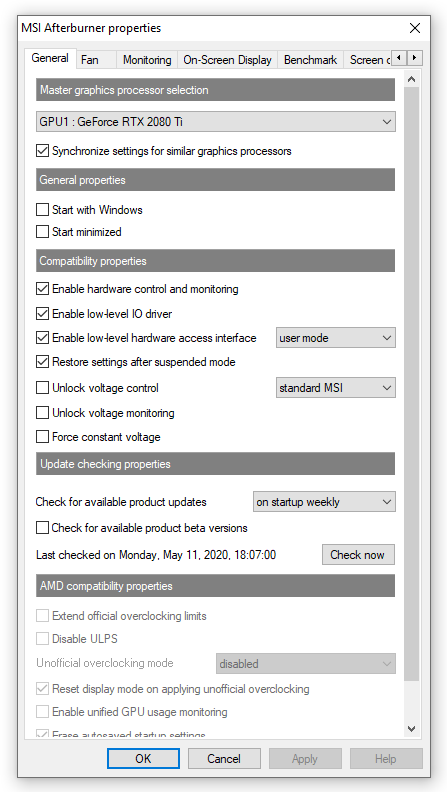
Step 6: With MSI Afterburner open, click the Gear⚙️icon to access the settings page.
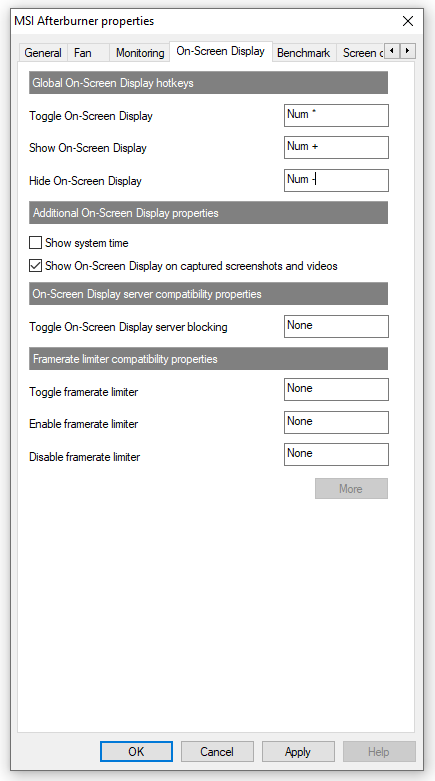
Step 7: Navigate to the tab labeled "On-Screen Display". This page will allow us to set a hotkey to show/hide the on-screen display so that it's not always in your way while gaming, and will allow you to turn it on when needed. I recommend using keys that are not commonly used while gaming. For the sake of my guide, I'll be using the - and + signs on the numpad.
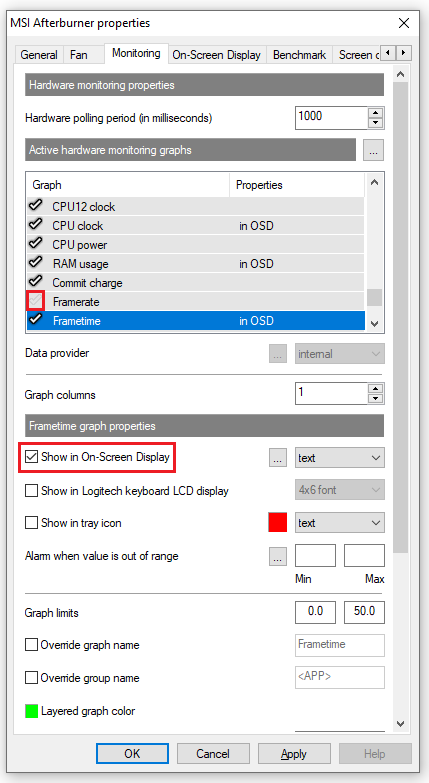
Step 8: With your hotkeys established, navigate to the Monitoring tab. This is where we will be picking and choosing the components we would like to monitor. To monitor a component or sensor, click the hardware sensor then check the box labeled "Show in On-Screen Display". If a sensor is grayed out, click the Checkmark icon to the left of the sensor. Repeat for each component or sensor you'd like to monitor. Note: The sensors you choose to monitor will be subjective, however I highly recommend starting with GPU temperature, GPU usage, Memory usage, Core clock, CPU temperature, CPU usage, CPU clock, RAM usage, Framerate and Frametime.
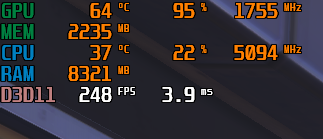
Step 9: Apply your settings and launch the game or benchmarking application you are using to test your system performance. By default, the performance statistics will be in the top left corner of the screen.
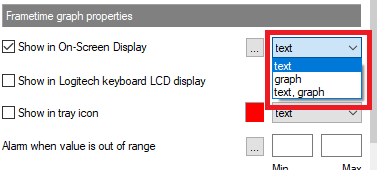
Extra tips: If you prefer graphs over text, you can select the drop down next to "Show in On-Screen Display" to enable a graph. This is extremely helpful when monitoring Framerate and Frametime data, as it will help illustrate when your performance dips.
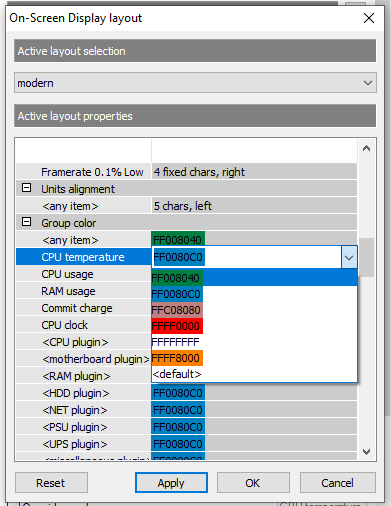
You can also click the box to the left of the drop down menu with "..." to customize the colors of the OSD text.
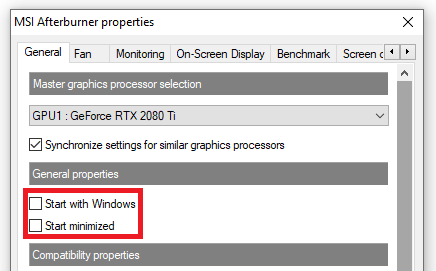
If you want these settings to persist through restarts without having to launch afterburner, you can enable the software to run at startup. Go to Settings and check "Start with Windows" and "Start minimized".
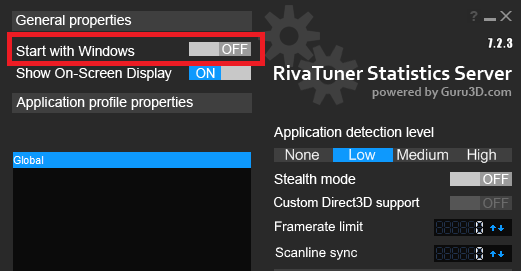
Make sure you allow RTSS to start with Windows as well.
That's it! You can now monitor your performance while gaming or benchmarking.
MSI Afterburner's primary feature is GPU overclocking, however for the purpose of this guide, we will be utilizing a very handy secondary feature to enable OSD or On-Screen Display to allow you to monitor a large variety of sensors and statistical information about your systems performance. From CPU/GPU thermals & utilization all the way to in-game FPS, this software is a staple for troubleshooting gaming performance in real-time. Before we begin, a quick disclaimer.
This third party software is to be used at your own risk. Before using it in video games, check with the developers to make sure it is allowed, as the software hooks into the Direct3D frame buffer to capture its performance information and may be viewed as a "cheat" by some anti-cheat software.
With that out of the way, let's get started!
Step 1: Download the latest version of MSI Afterburner from the manufacturers website: https://www.msi.com/page/afterburner

Step 2: Extract the downloaded software to an easily accessible location and run the installer.

Step 3: During installation , make sure you keep RivaTuner Statistics Server checked, as we will need that software to utilize the OSD functionality.

Step 4: Complete the installation process for both MSI Afterburner and RTSS. Remember to switch over to the RTSS installation window as it may not do so automatically. NOTE: The installer may install additional DirectX libraries if they are not currently available on your system, this is normal.

Step 5: Launch MSI Afterburner. Note: You may be greeted with a popup from RTSS informing you that some information cannot be hooked right now. This is completely normal, it simply means some applications are already open and that they cannot be monitored until they are closed and reopened.

Step 6: With MSI Afterburner open, click the Gear⚙️icon to access the settings page.


Step 7: Navigate to the tab labeled "On-Screen Display". This page will allow us to set a hotkey to show/hide the on-screen display so that it's not always in your way while gaming, and will allow you to turn it on when needed. I recommend using keys that are not commonly used while gaming. For the sake of my guide, I'll be using the - and + signs on the numpad.

Step 8: With your hotkeys established, navigate to the Monitoring tab. This is where we will be picking and choosing the components we would like to monitor. To monitor a component or sensor, click the hardware sensor then check the box labeled "Show in On-Screen Display". If a sensor is grayed out, click the Checkmark icon to the left of the sensor. Repeat for each component or sensor you'd like to monitor. Note: The sensors you choose to monitor will be subjective, however I highly recommend starting with GPU temperature, GPU usage, Memory usage, Core clock, CPU temperature, CPU usage, CPU clock, RAM usage, Framerate and Frametime.

Step 9: Apply your settings and launch the game or benchmarking application you are using to test your system performance. By default, the performance statistics will be in the top left corner of the screen.

Extra tips: If you prefer graphs over text, you can select the drop down next to "Show in On-Screen Display" to enable a graph. This is extremely helpful when monitoring Framerate and Frametime data, as it will help illustrate when your performance dips.

You can also click the box to the left of the drop down menu with "..." to customize the colors of the OSD text.

If you want these settings to persist through restarts without having to launch afterburner, you can enable the software to run at startup. Go to Settings and check "Start with Windows" and "Start minimized".

Make sure you allow RTSS to start with Windows as well.

That's it! You can now monitor your performance while gaming or benchmarking.
Categories
- All Categories
- 1 The Blog
- 1 What's Trending
- 8K The Community
- 3.2K General Discussion
- 146 New Members
- 873 Consumer Tech
- 234 Prebuilt PCs and Laptops
- 168 Software
- 33 Audio/Visual
- 54 Networking & Security
- 4 Home Automation
- 5 Digital Photography
- 14 Content Creators
- 30 Hobby Boards & Projects
- 84 3D Printing
- 83 Retro Arcade/Gaming
- 62 All Other Tech
- 448 PowerSpec
- 2.6K Store Information and Policy
- 150 Off Topic
- 63 Community Ideas & Feedback
- 619 Your Completed Builds
- 4K Build-Your-Own PC
- 2.9K Help Choosing Parts
- 328 Graphics Cards
- 335 CPUs, Memory, and Motherboards
- 145 Cases and Power Supplies
- 54 Air and Liquid Cooling
- 50 Monitors and Displays
- 93 Peripherals
- 69 All Other Parts
- 65 Featured Categories
We love seeing what our customers build
Submit photos and a description of your PC to our build showcase
Submit NowLooking for a little inspiration?
See other custom PC builds and get some ideas for what can be done
View Build ShowcaseSAME DAY CUSTOM BUILD SERVICE
If You Can Dream it, We Can Build it.

Services starting at $149.99
